R: Read the Methods and Results Read & Annotate the Methods and Results
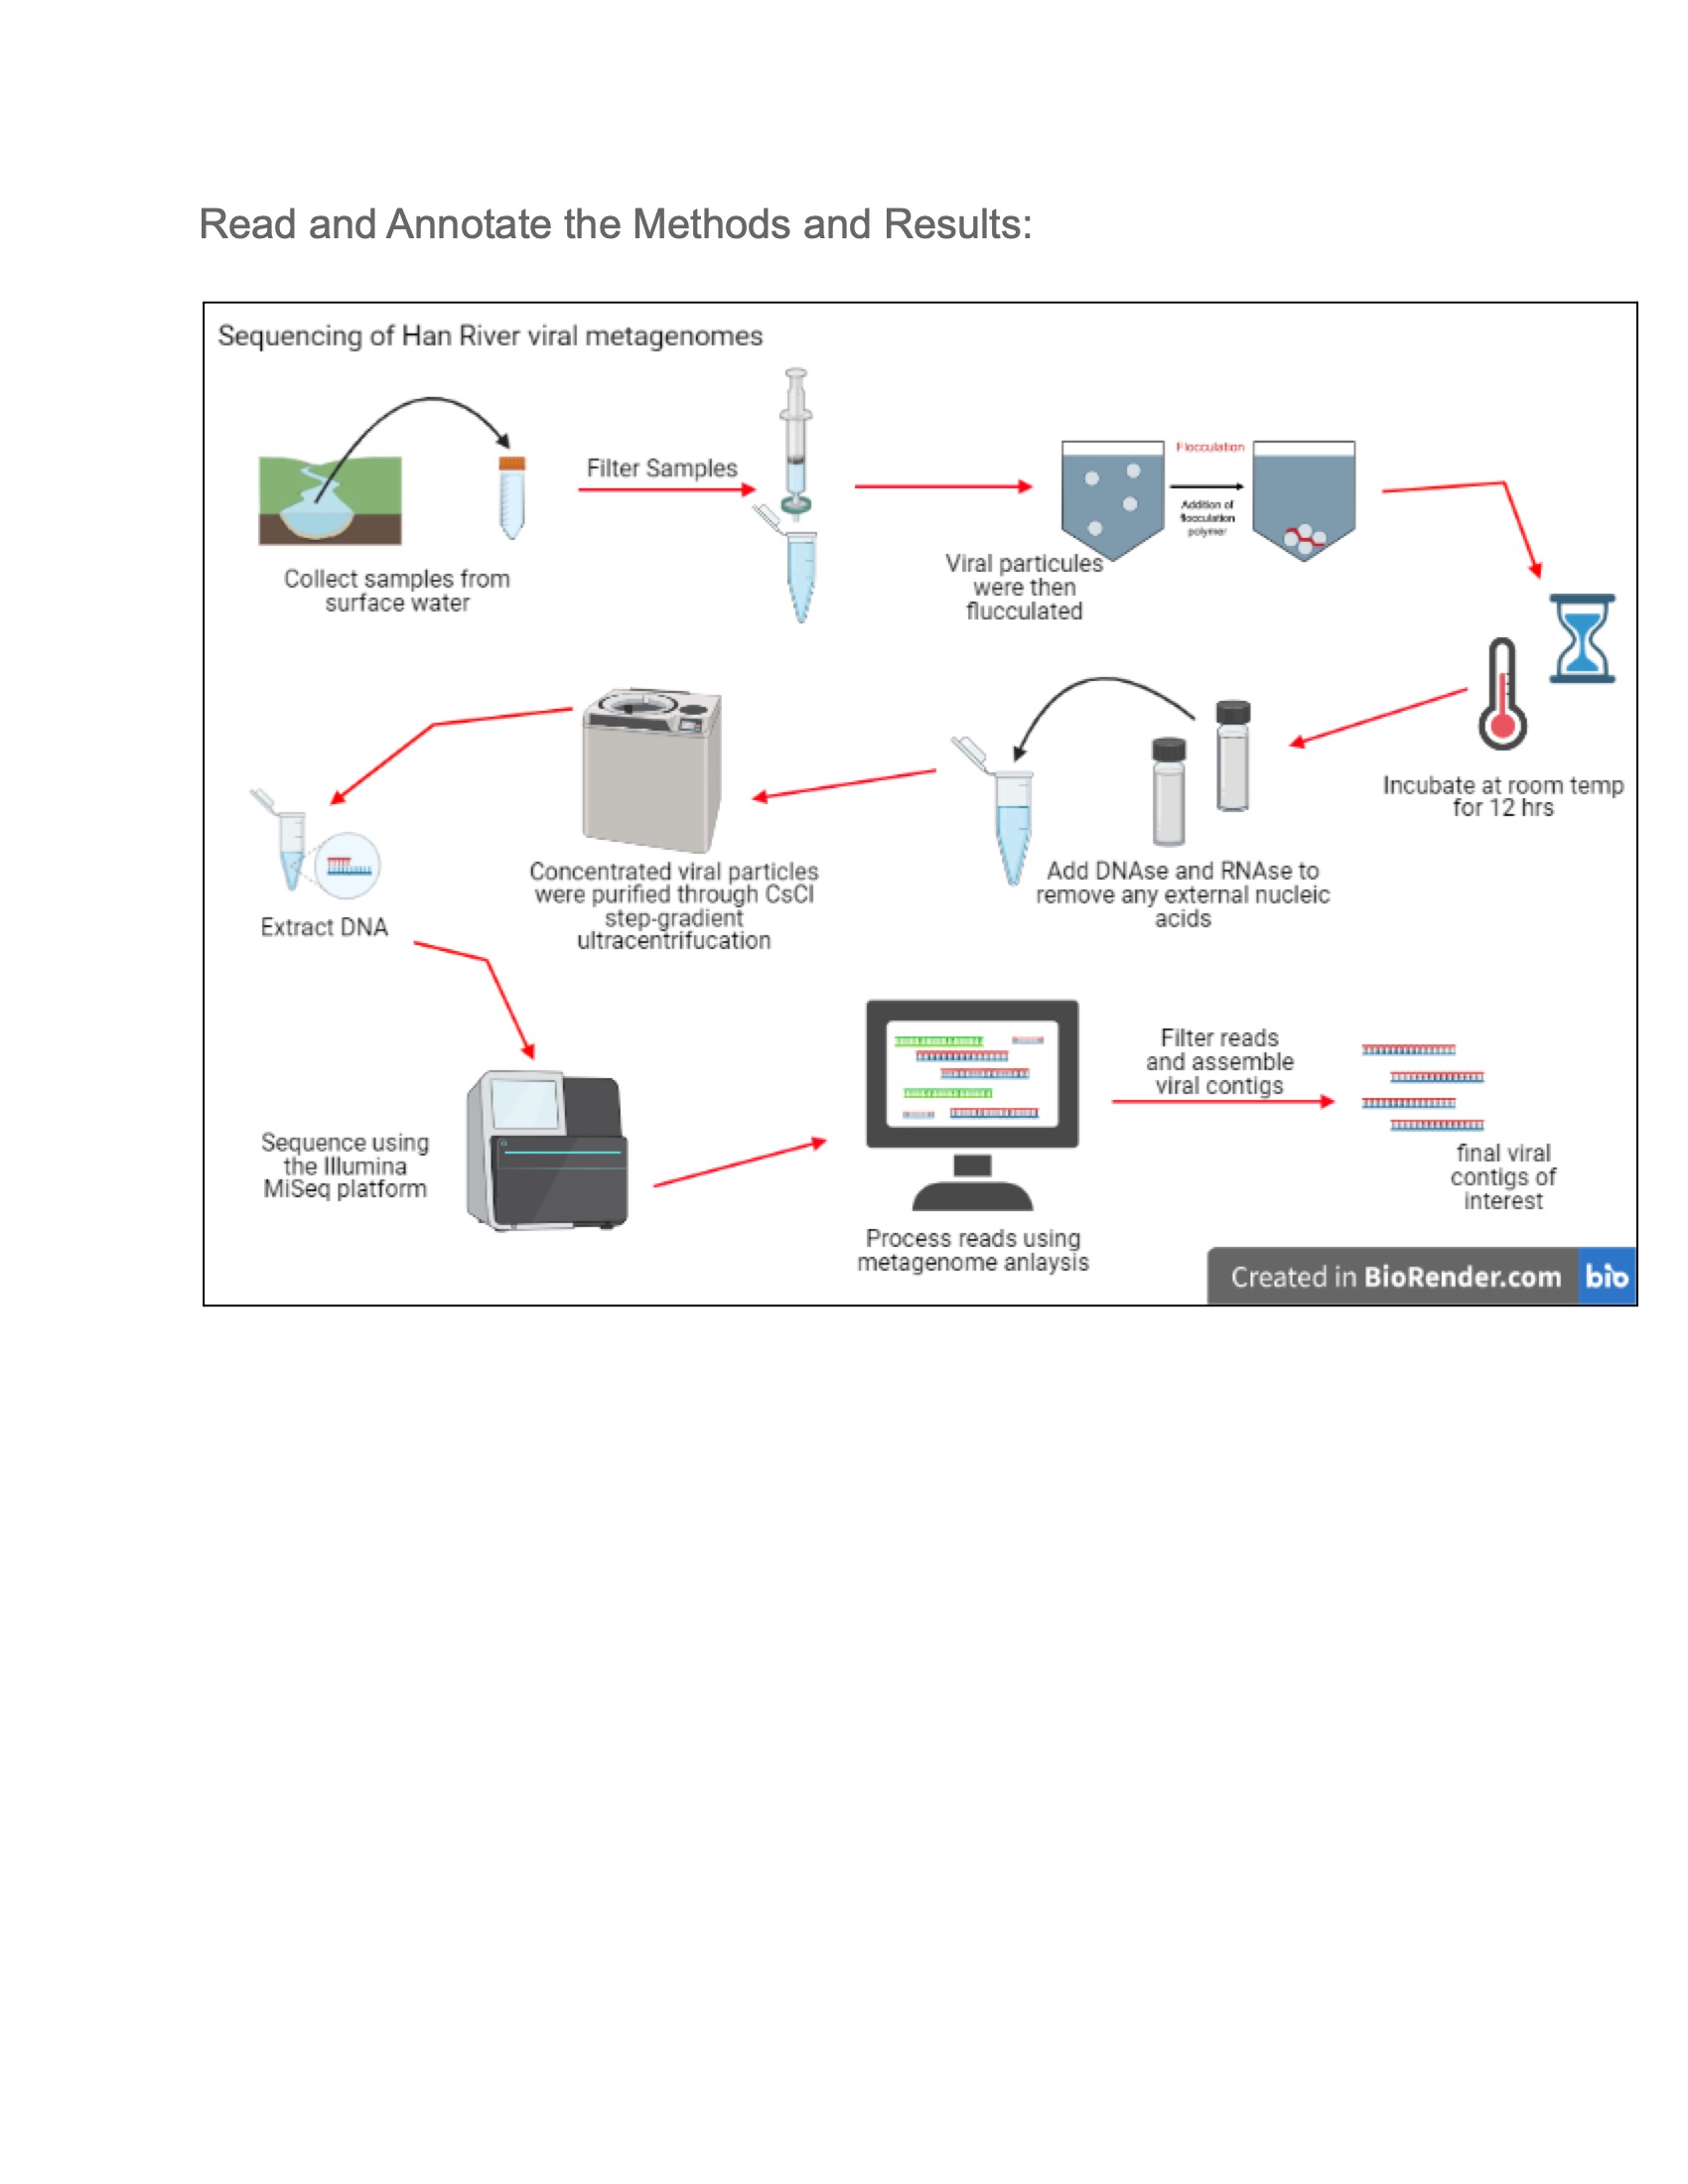
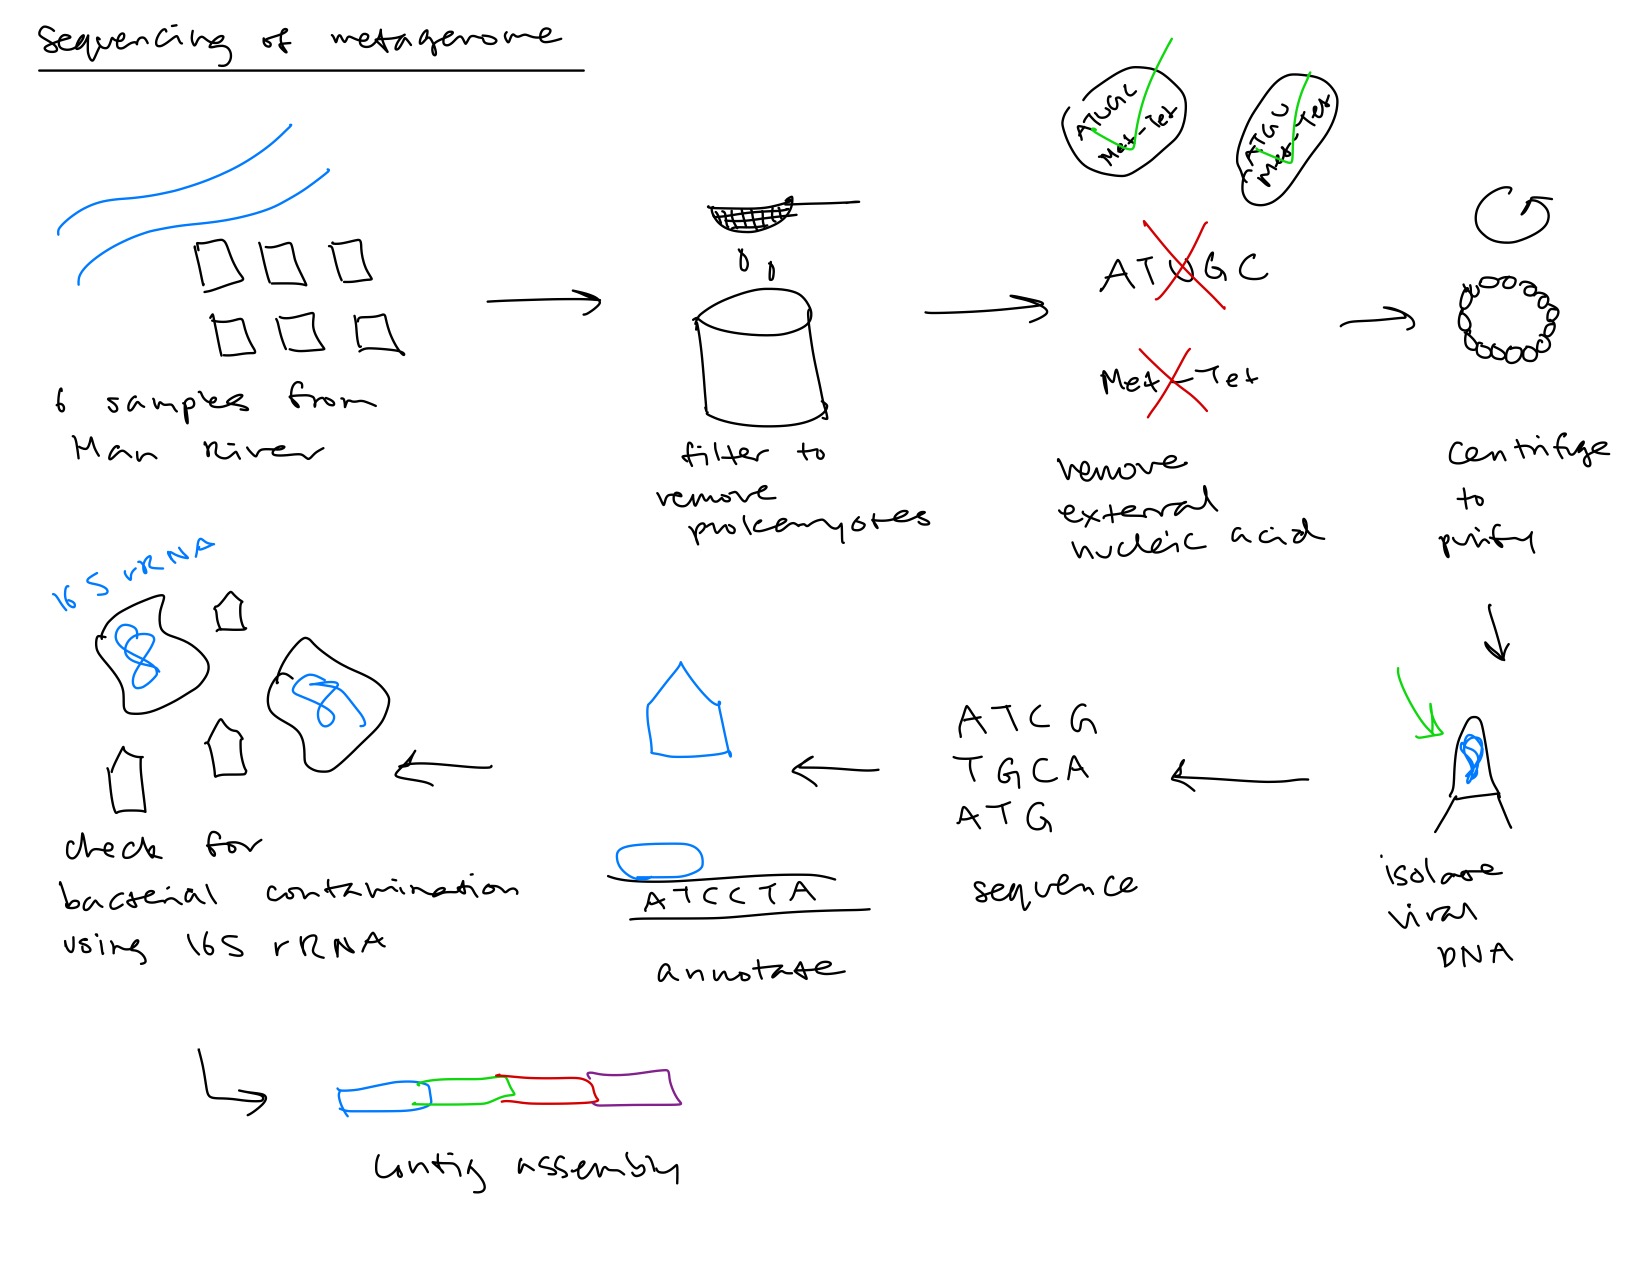
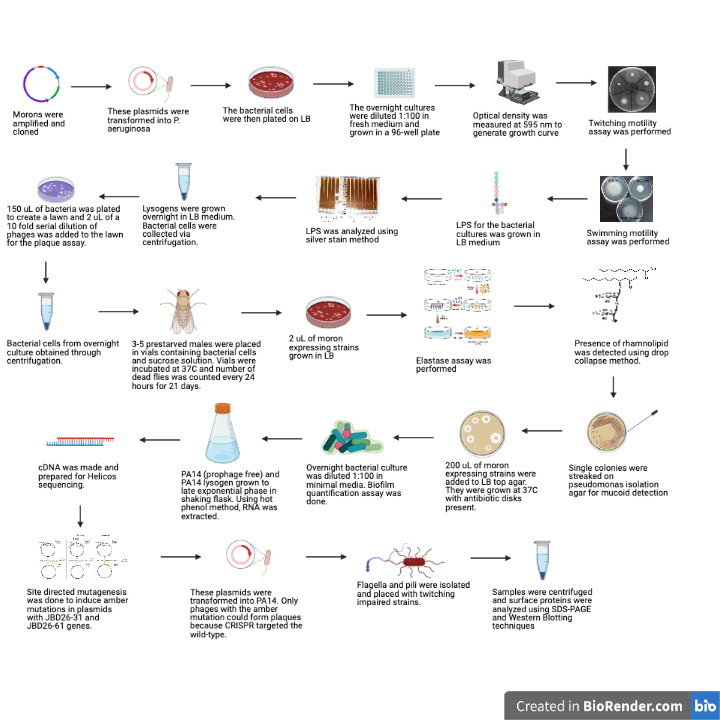
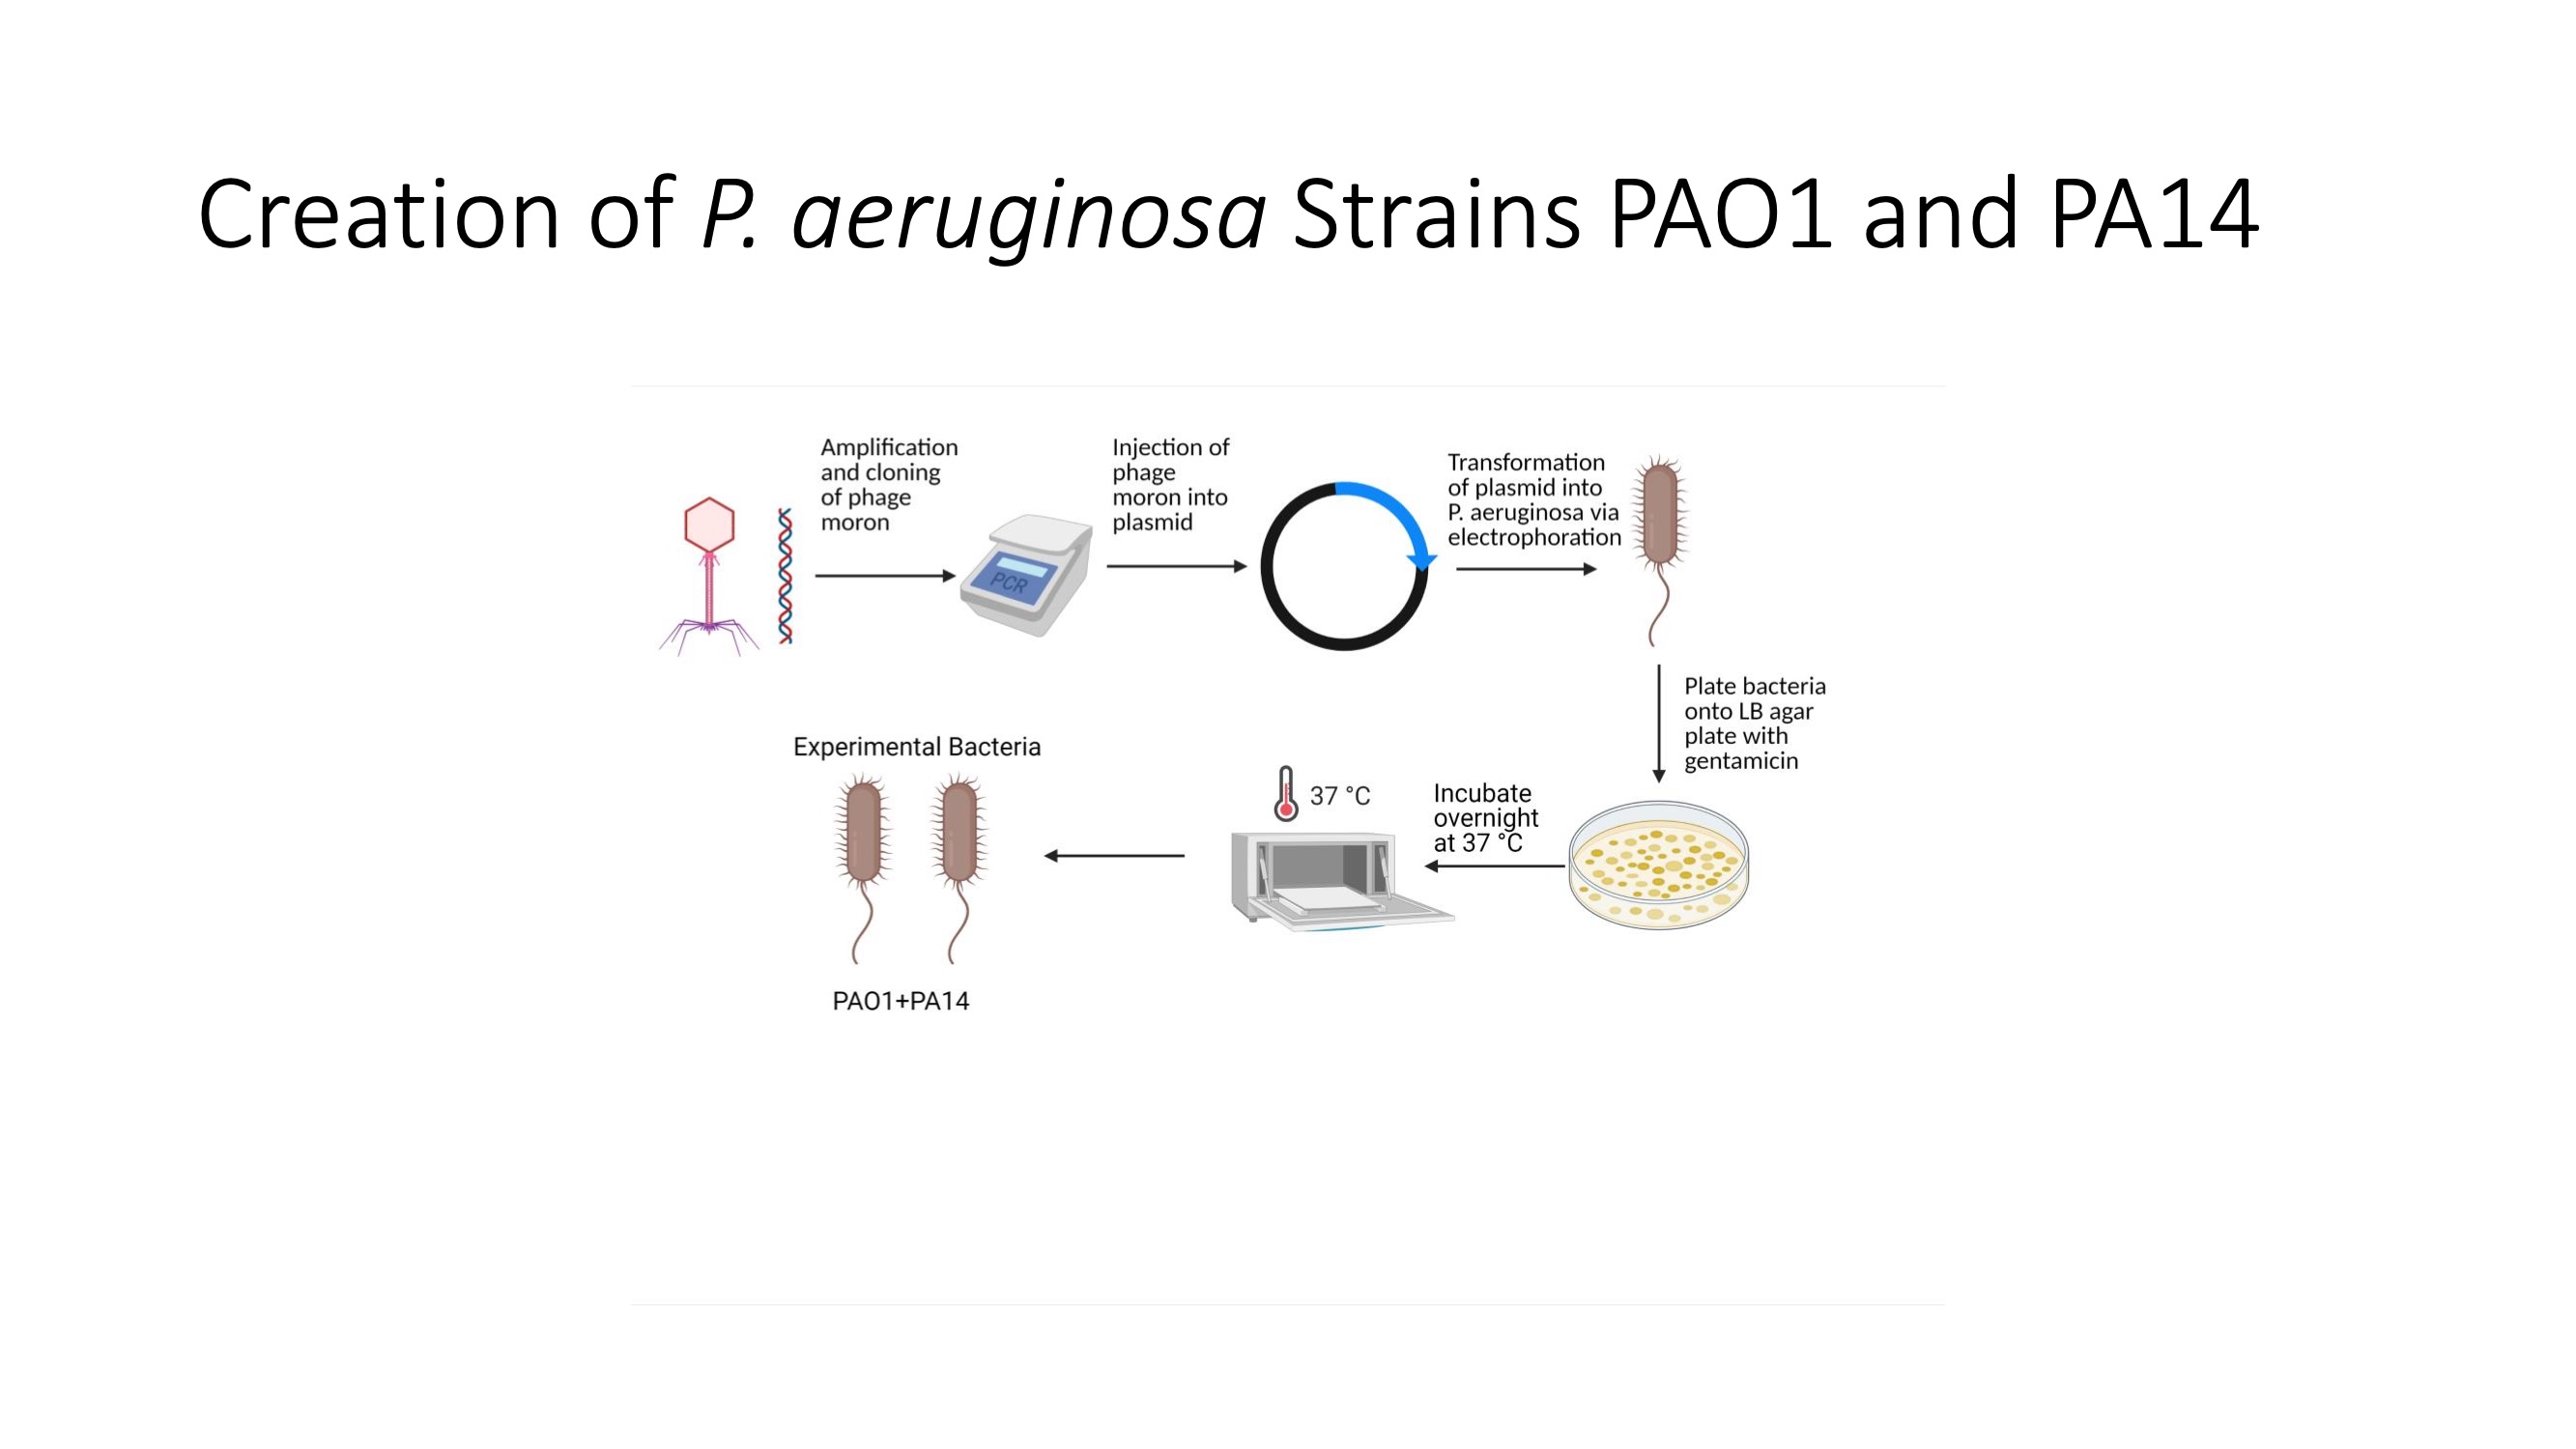
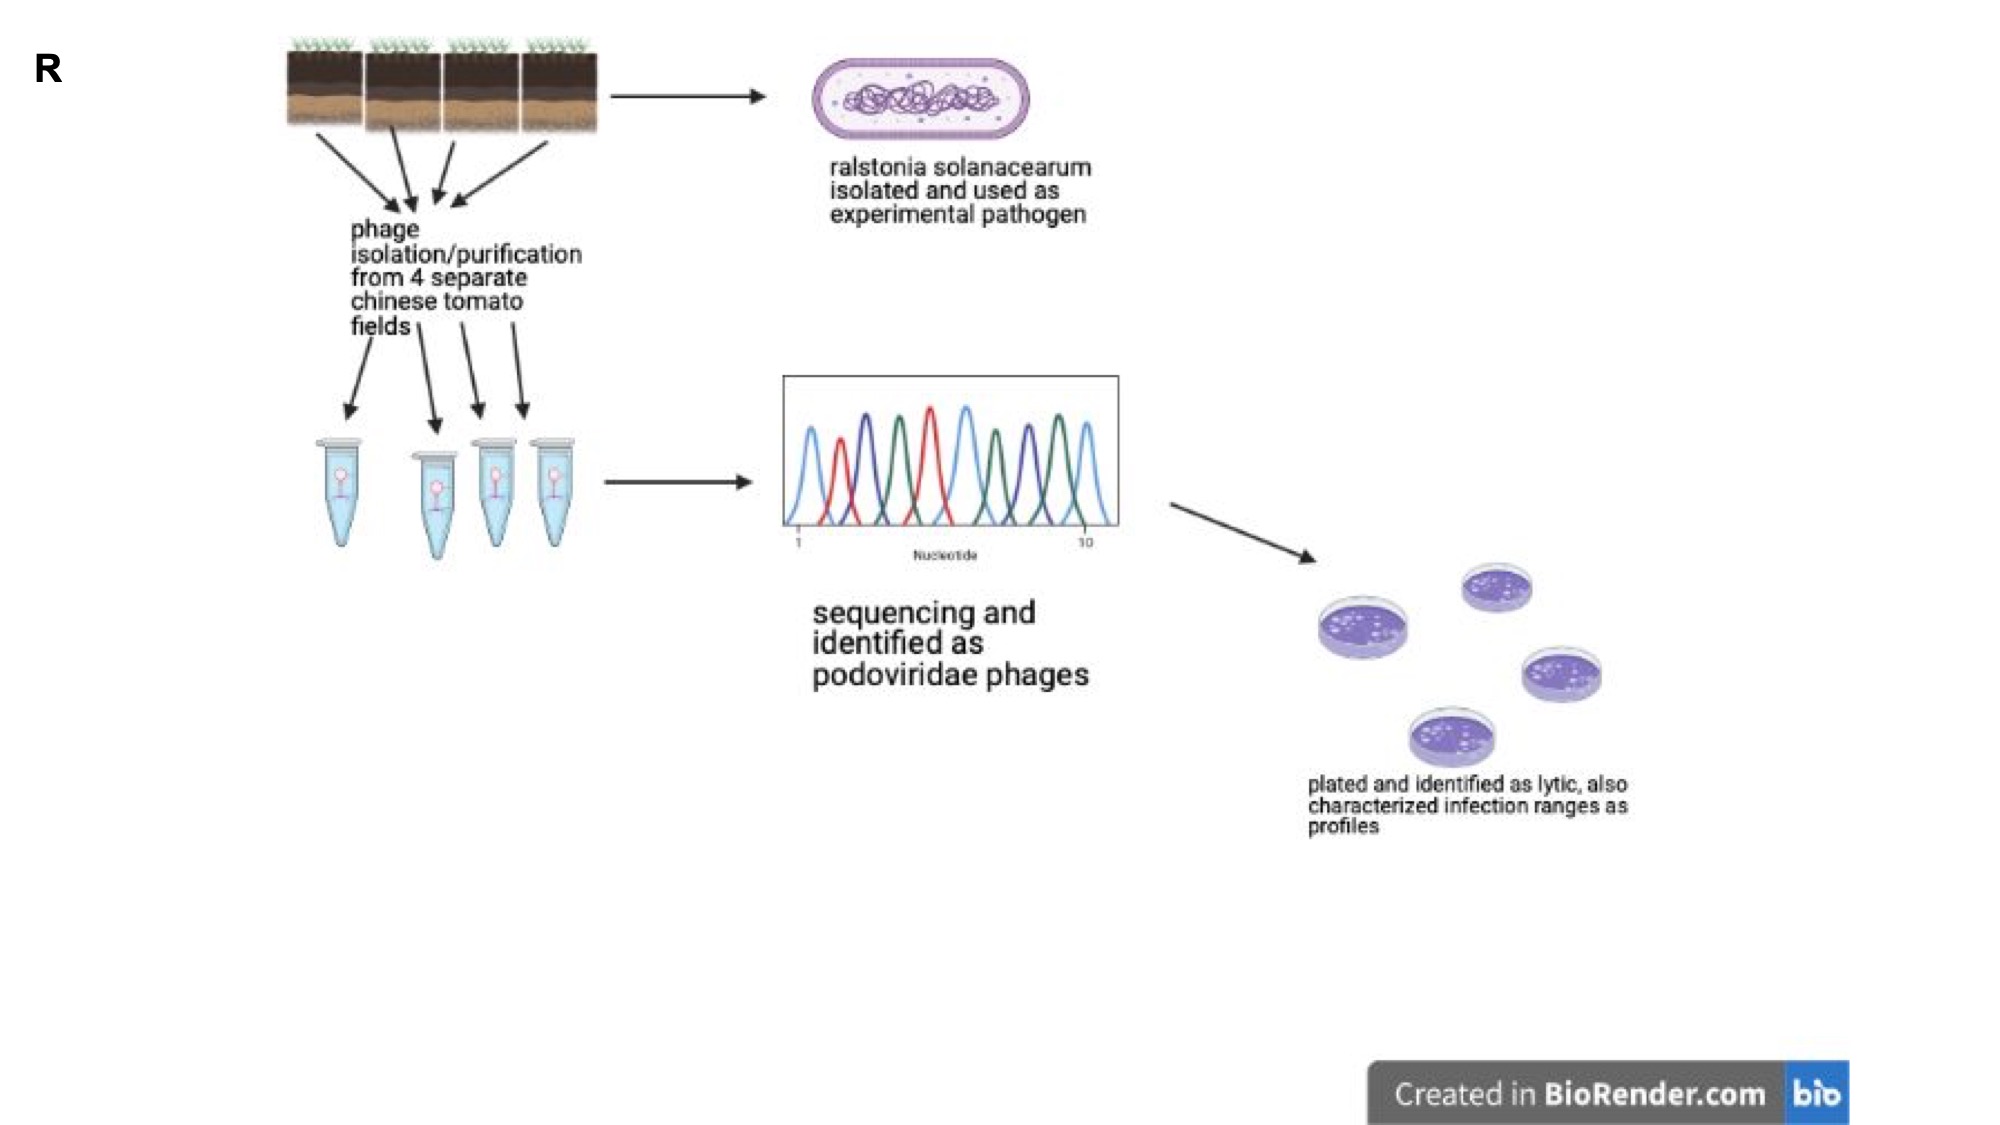
The idea in this step is that you will determine how each experiment was performed by going through the Results section figure by figure and creating cartoons of the corresponding Methods section. You will ‘‘work backwards’’ from the data presented in each figure (or table) to understand the methods. In other words, link what was actually done in each experiment and the data that were obtained.
Draw the Methods
"This was my favorite step. I really enjoy drawing, so this step helped me really visualize how each experiment was done." - A successful CREATES student.
- Read methods and results sections: As you read these sections, look up unfamiliar terms to help your understanding.
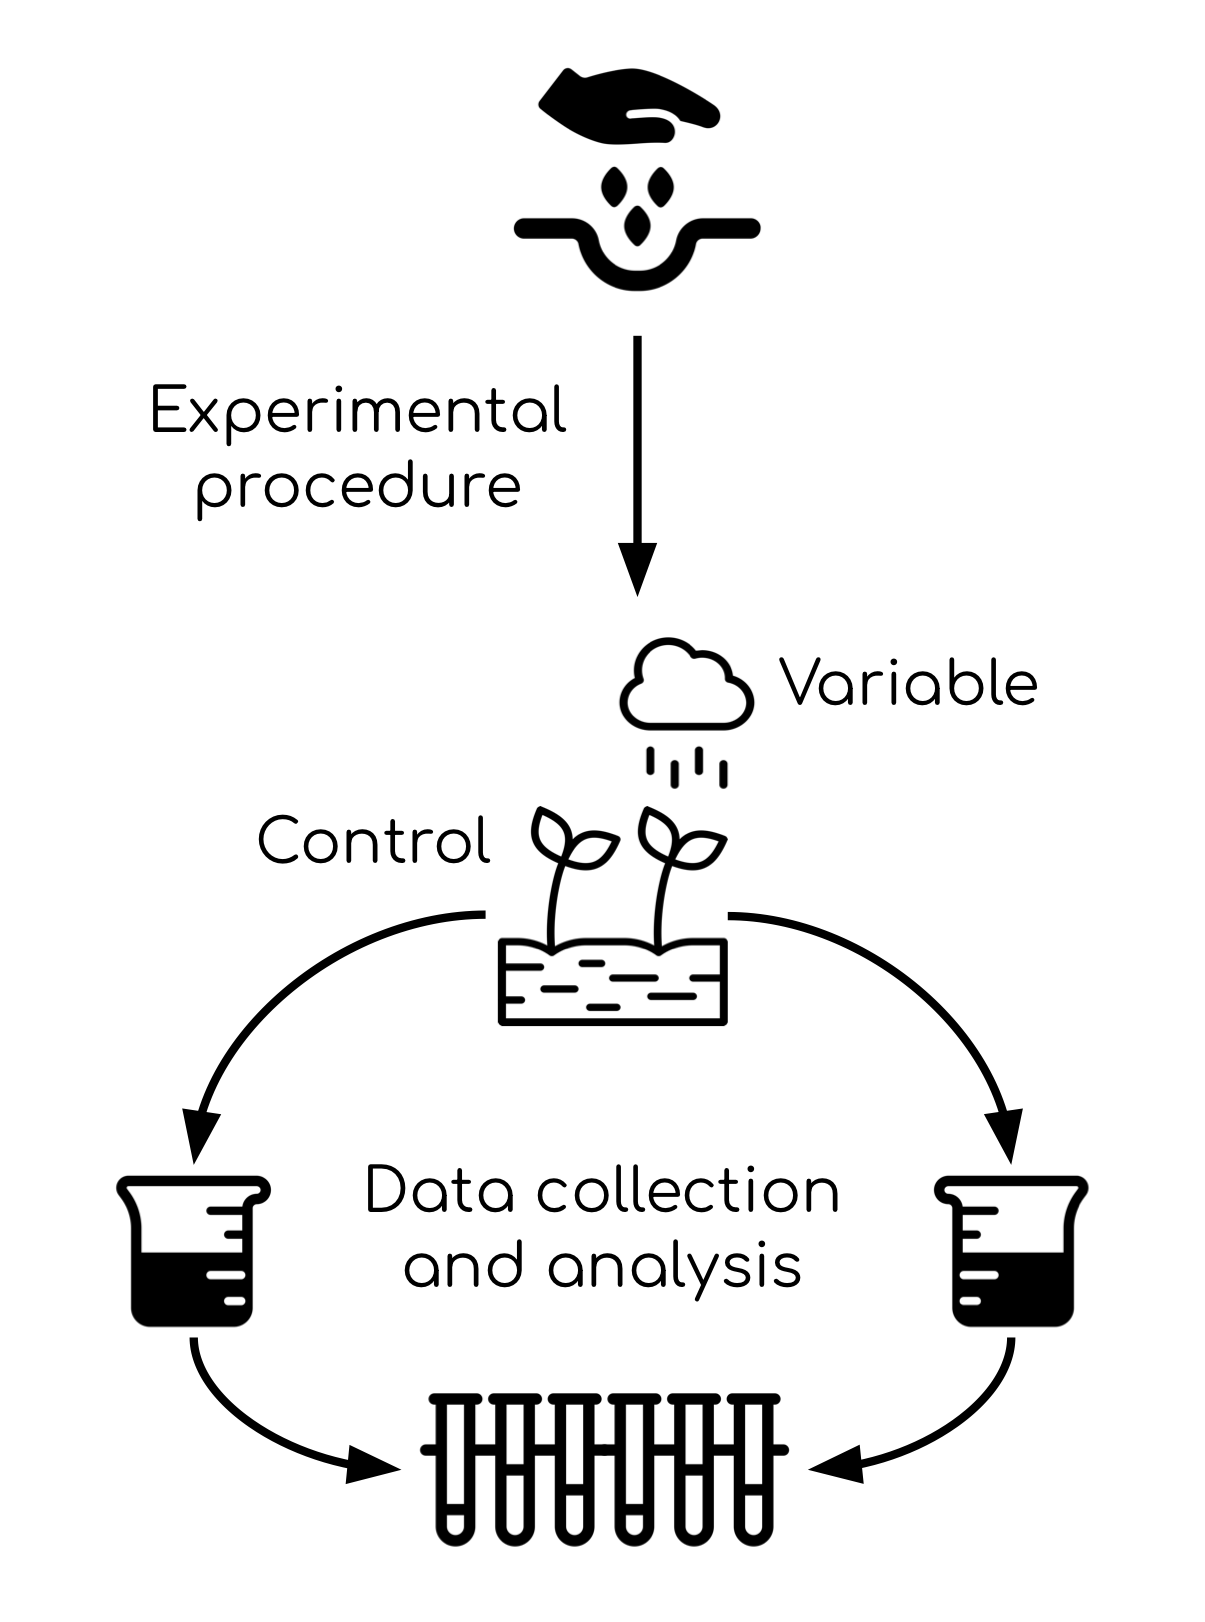
- Diagram/cartoon the methods: Based on your reading of the methods section, create a visual diagram of the methods on a sheet of paper. Your diagram can include drawings, arrows, labels, numbers, and anything else that demonstrates the method. Indicate how the study was actually conducted, including exprimental design and data collection/analysis.
- Should be pictures or visual representations, not just flow charts
- Include experimental design and how the data were collected and analyze
- You don’t need to include details about volumes and concentrations, but you should include controls and variables.
- You should include flow charts for bioinformatics or statistical data analysis.
Annotate the Figures
"Reading the paper while writing meaningful annotations increases understanding significantly." - A successful CREATES student.
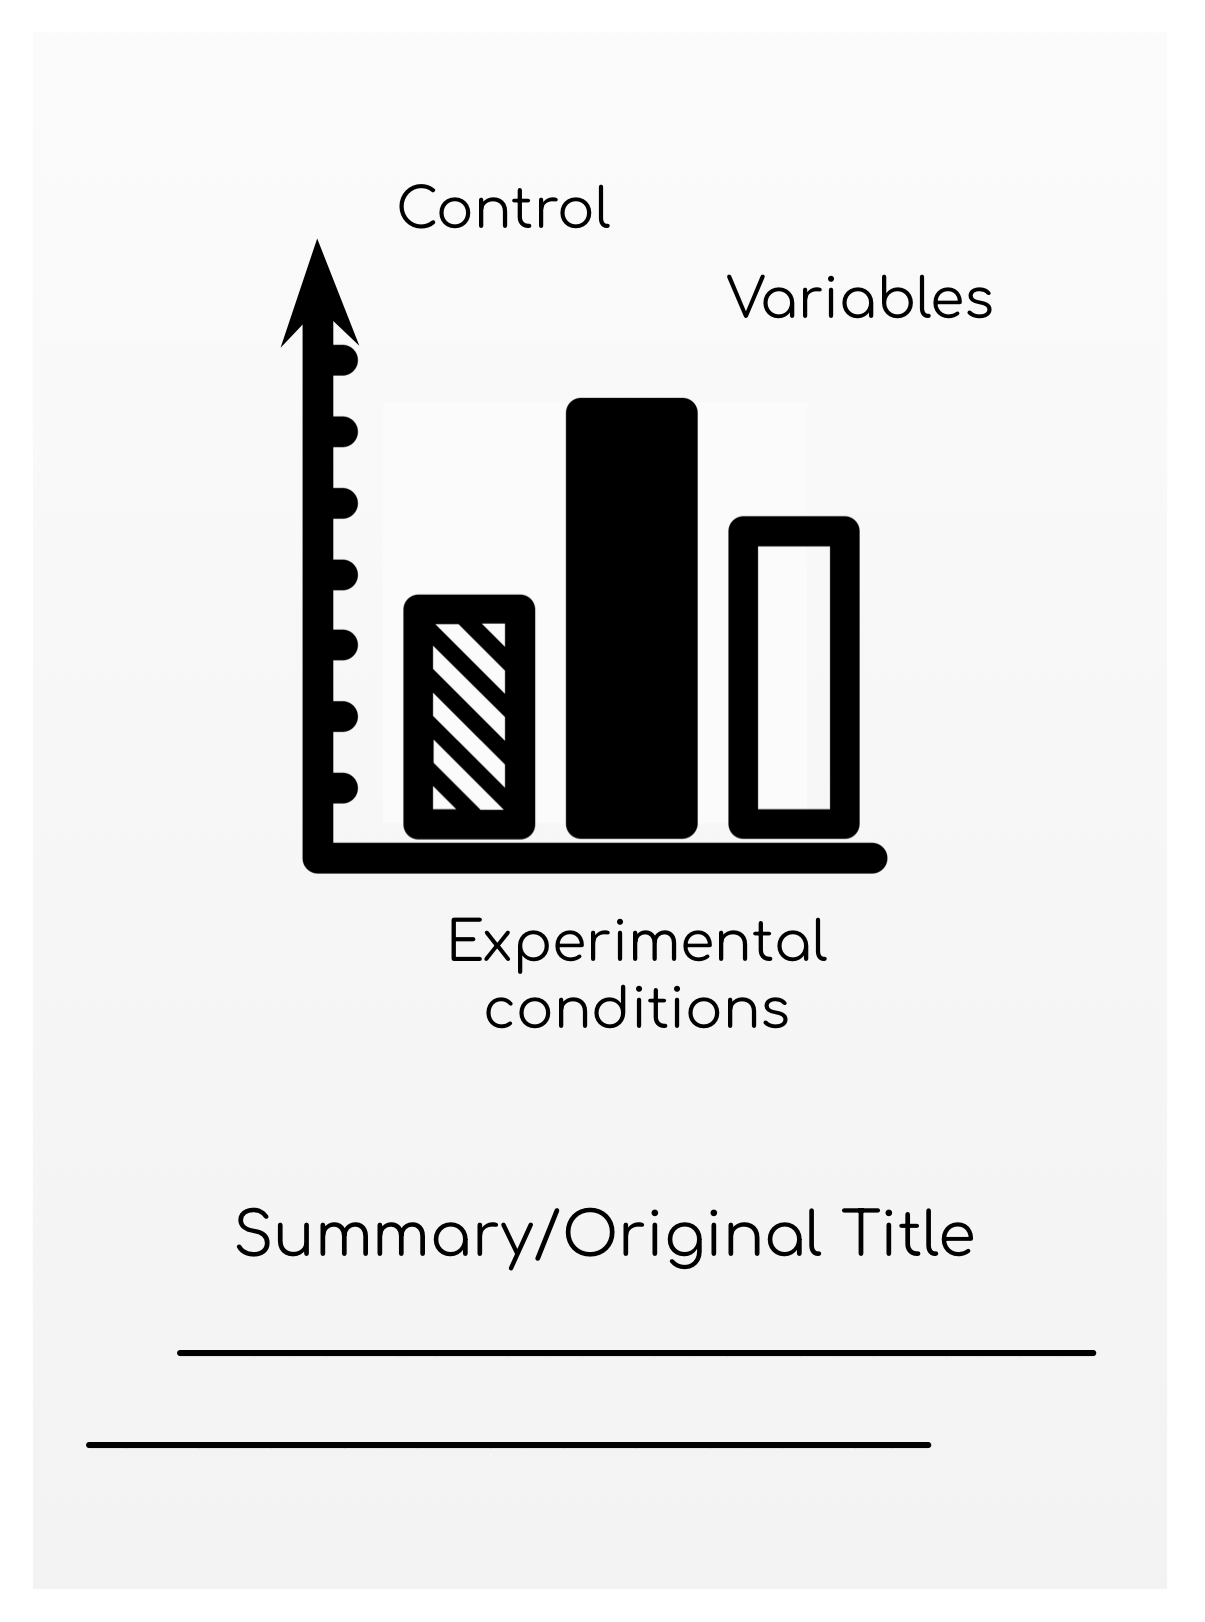
- Label the figures: Annotate all the figures in the article in order to come to a better understanding of them. Use information from the figure legend to add labels for controls, experimental conditions, and any other information.
- Summarize the figures: Write a title or summary for each figure in your own words. You can do this in the margins of the article or on a separate sheet of paper.
- Re-read and annotate results: Now that you have a fuller understanding of the methods, re-read and annotate the results in order to see how they are produced by the methods.